David A. Kenny
April 9, 2016
Multiple Latent Variable Models:
Confirmatory Factor Analysis
Standard Exploratory Factor
Analysis Model or EFA
Every measure loads on each
factor
either
uncorrelated (orthogonal) or correlated (oblique)
generally
factors are uncorrelated
Because with more than one
factor, the solution is not unique (i.e., underidentified), it can be rotated.
To test if k factors are sufficient to explain the covariation between measures estimate the following loading matrix (assuming k = 5) with orthogonal or uncorrelated factors with unit variance:
Measure
1
2
3
4 5
1
x
0
0 0
0
2
x
x
0 0
0
3
x
x
x 0
0
4
x
x
x x
0
5
x
x x
x
x
6
x
x
x x
x
7
x
x
x x
x
8
x
x
x x
x
If a model with this loading structure is good fitting (see Measures of Fit), then k factors are sufficient.
EFA is useful when the researcher does not know how many factors there are
or when it is uncertain what measures load on what factors.
Find out about a book
that discusses both EFA and CFA.
Confirmatory Factor Analysis Model or CFA (an
alternative to EFA)
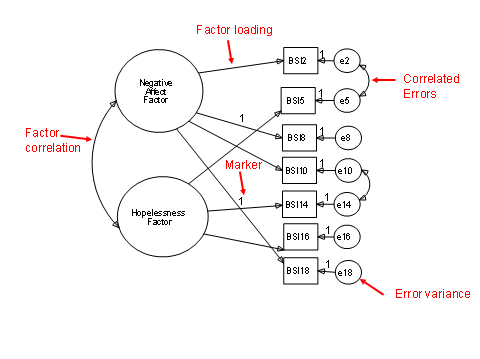
Typically, each variable
loads on one and only one factor.
Factors are correlated
(conceptually useful to have correlated factors).
Generally errors (or
uniquenesses) across variables are uncorrelated.
Variables in CFA are usually
called indicators.
Parameters
Loadings
Path from the latent variable to the indicator
Standardized
path is a factor loading.
At
least one loadings per factor is fixed to one (marker variable).
Error variance for
each indicator
Factor variance
(fixed to one in EFA, but not in CFA)
Factor covariance
Unlike EFA, latent variables are correlated.
Degrees of Freedom (df)
for CFA Models
Unknowns
Free loadings (do not
count marker variable or loadings set equal)
Error variances
Correlated errors
Factor variances
Factor correlations
Knowns: k(k + 1)/2
Typically CFA models with several factors and indicators have many df.
Identification
Given k factors, there must be k2 constraints.
Usually k of these constraints are scaling ones
(i.e., marker variables).
The standard EFA model
with two or more factors and all the loadings free is not identified.
This is why the solution can be rotated.
Standard
CFA model: Simple Structure
Each measure or indicator loads on one and only one factor which implies no
double loadings.
No correlated errors
Latent variables correlated
Simple Structure CFA model
is identified:
If
there are, at least, two indicators per latent variable and the errors of those
two or more indicators are uncorrelated with each other and with at least one
other indicator on the other latent variables.
Testing in
CFA and Structural Equation Modeling
Principle of
nesting: Model A is said to be nested within Model B, if Model B is a
more complicated version of Model A. For example, a one-factor model is nested
within a two-factor as a one-factor model can be viewed as a two-factor model
in which the correlation between factors is perfect).
Relative fit of a nested
model: the chi square difference test, the smaller chi square and its degrees
of freedom are subtracted from the larger chi square and degrees of freedom.
In principle, the more
complicated model should fit for the test to be valid.
Discriminant Validity
Definition of poor
discriminant validity: The correlation between two factors is or is very close
to one or minus one.
Consequences
multicollinearity: If the factors are treated as
causes of a third factor, the high collinearity leads to very large standard
errors.
problems of convergence and inadmissabile solutions
Criteria: A correlation of .85 or larger in absolute value indicates poor
discriminant validity
Test: Estimate a model that fixes the correlation to one (Do not use a
marker variable strategy, but instead fix factor variances to one.) or collapse
the two factors and see if the model fit worsens.
Example 1: Unpublished Master’s Thesis of Julie Fenster: “Multidimensional measurement of Religiousness/Spirituality for use in health research assessment developed by the Fetzer Institute”
Three Latent Variables
Daily Spiritual
Experiences (DSE)
I feel God’s presence.
I am touched by the beauty of creation.
Private Religious
Practices (PRP)
Private prayer.
Read the Bible.
Positive Religious and
Spiritual Coping (PRSC)
Think about life as part of a larger spiritual force.
I look to God for strength, support and guidance.
Correlations
DSE
with PRSC = .869
PRP
with PRSC = .918
DSE
with PRP = .910
See also “Exploring the Dimensionality of "Religiosity" and "Spirituality" in the Fetzer Multidimensional Measure” by J. A. Neff, Journal for the Scientific Study of Religion, 45, 449‑459.
Example 2: Salovey, P., & Rodin, J. (1984). Some antecedents and consequences of social-comparison jealousy. Journal of Personality and Social Psychology, 47, 780-792.
One latent variable model χ²(5) = 24.305
Two latent variable model χ²(4) = 8.669
chi square difference test: χ²(1) =
15.636, p < .001
conclusion:
two latent variables are needed
Salovey & Rodin Example with Standardized Estimates

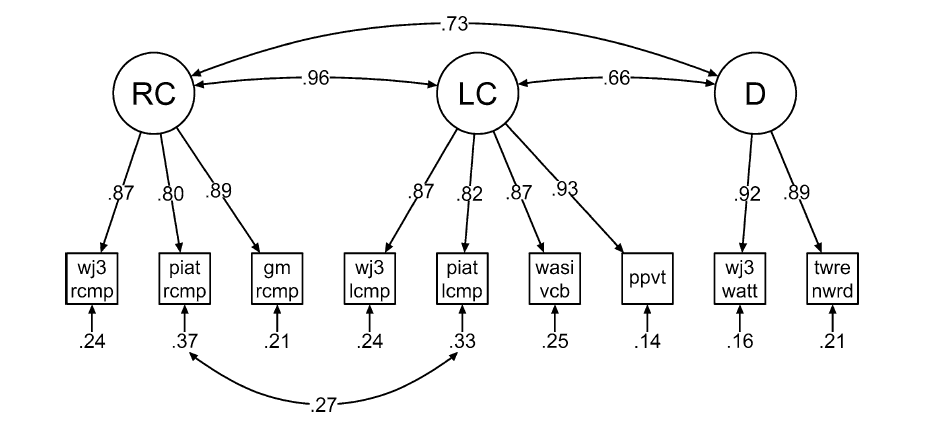
Example 3: Braze, D., Katz, L., Magnuson, J. S., Mencl, W. E., Tabor, W., Van Dyke, J. A., Gong, T., Johns, C. L., & Shankweiler, D. P. (2016). Vocabulary does not complicate the Simple View of Reading. Reading and Writing, 29, 435-451: In this paper, they show that language comprehension (LC) and reading comprehension (RC) have poor discriminant validity.
Braze et al. Example (Standardized Estimates)
Respecification
(see Respecification
page for more detail)
Criteria
Empirical
(again see Respecification page for more details)
Correlation matrix
Modification indices (also called Lagranian multipliers)
The
estimated change in chi square if the parameter were freely estimated.
Standardized residuals
If
model is correctly specified, large values (greater than 1.96 in absolute
value) indicate correlations poor fitted.
In
my experience, these values tend to be conservative (i.e., too small).
Theoretical:
All respecifications require some rationale and that rationale should be
extended to other cases.
Types of
Respecifications
Resulting in a MORE COMPLEX
MODEL (i.e.,
more parameters)
Another factor
Correlated errors
definition:
Variance not explained by theoretical constructs may covary across two
measures. Such covariance is referred to as a correlated error.
Double loadings
Resulting in a SIMPLER
MODEL
(i.e., few parameters)
Note that making the model
simpler, while often a very reasonable thing to do, does not improve the fit of
the model.
Fewer factors
Equal loadings (should be done using the covariance matrix or raw data)
Specialized
Issues
How many indicators per factor?
2 is the minimum
3 is safer, especially
if factor correlations are weak
4 provides safety
5 or more is more than
enough (If too many indicators then combine indicators into sets)
What to do about “too many” indicators? Parcels or “testlets”
Definition: Adding (or
averaging) sets of indicators up to create a smaller number of indicators
Strategies
random
conceptually similar sets
sets that may contain items with correlated errors
Disadvantages of parceling
loss of information
possibility of specification error
that is missed and becomes undetectable
Advantages of parceling
smaller models (better
participant to parameter ratio)
more “normal” distributions of variables
usually better fit
Compromise
strategy: Run individual CFA on each latent variable and then parcel.
Single Indicators
measures with no measurement error
Treat as variable in most programs but LISREL requires
fix loading to one
free variance if exogenous or disturbance if endogenous
fix error variance to zero
do not correlate its "error variance" with anything
measures with measurement error
fix loading to one
free variance if exogenous or disturbance variance if endogenous
error variance
fix to a known value (see Williams and Hazer) or
find an instrumental variable
Models with Means
Strategy 1
fix
factor mean (if exogenous) or intercept (if endogenous) to zero
free
all indicator intercepts
Strategy 2
free
factor mean (if exogenous) or intercept (if endogenous)
fix
the marker variable’s intercept to zero
free
all other indicators’ intercepts
The model fit and other
parameter estimates (e.g., loadings) are the same for both strategies.
Most people find the second strategy simpler and easier to work with.