September 9, 2011
Page being revised.
Send comments and suggestions.
Psychometrics
Standard Formulation
Model: Score = True Score plus Error or X = T + E
Note that T and E
have implicit coefficients of 1
Assumptions
Average error of zero
True
score and error uncorrelated
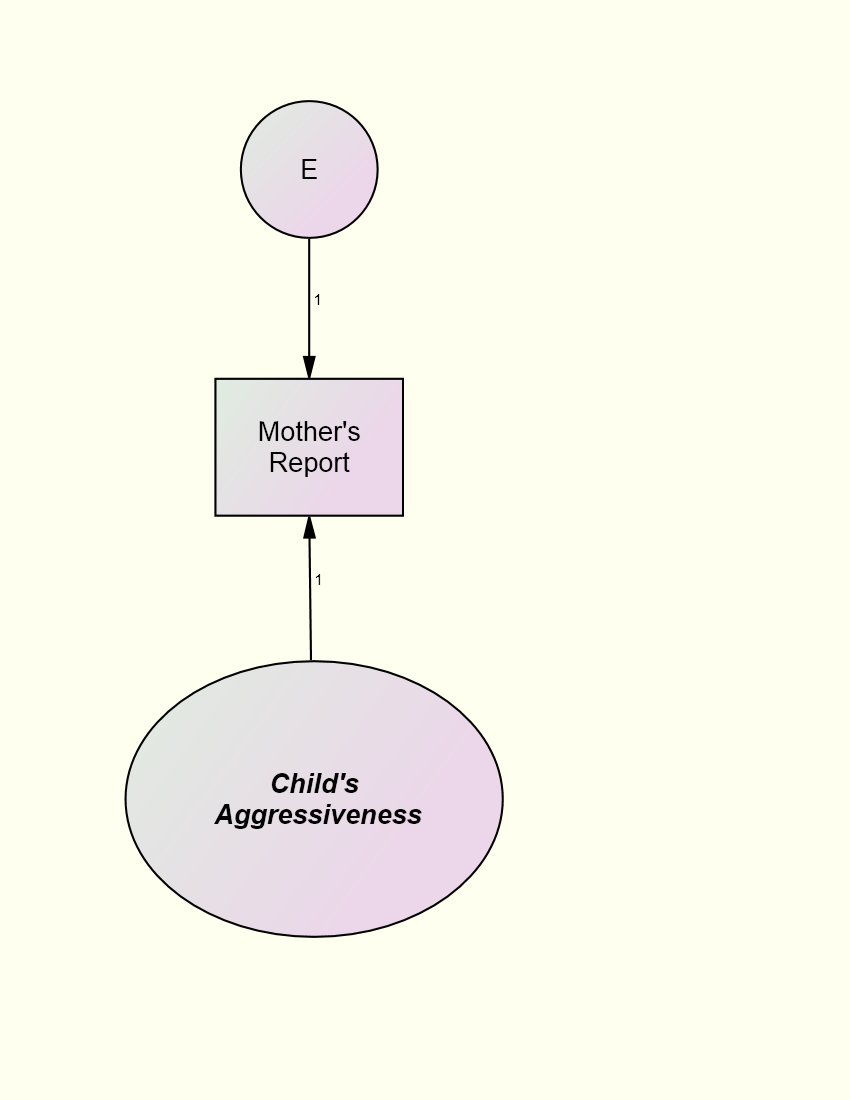
Example
Mothers report of childs aggression (X) is determined by true
aggression (T) and error (E). Notice that the paths are both 1 and the E
and T are uncorrelated:
Definition of
Components
Classical
True
score: the meaningful portion of variance or the average of all possible
measures of the true score Measurement error: irrelevant sources of variance or the score minus the true score.
Modern (i.e., Generalizability Theory)
The variance of the score consists of many
different components. In a particular research context, some of these
components are meaningful (the true score in that context) and others are not
(error in that context).
Reliability
The proportion of
variance due to true score or V(T)/V(X) where "V" means
variance.
Do not confuse
reliability with how to measure it (e.g., internal consistency or
test-retest). Reliability refers not just to the measure, but to sample
and context of measurement. Thus, with a different sample or context, it
can change.
Use RELCOMP, a computer
program for reliability computation.
Standardized Model
If all the variables are standarized the X = aT +bE.
The path from the true score or T to measured variable or X when both variables are standardized equals the square root of the reliablity. Thus, the correlation of the measure with the true score equals the square root of the reliablity.
Reliability Estimation
Is the score repeatable?
Different Measures (or Observers): Internal
Consistency
Standard measure: Cronbach's alpha
Formula:

Different Times
Test-retest
correlation (Presumes no change in the true score)
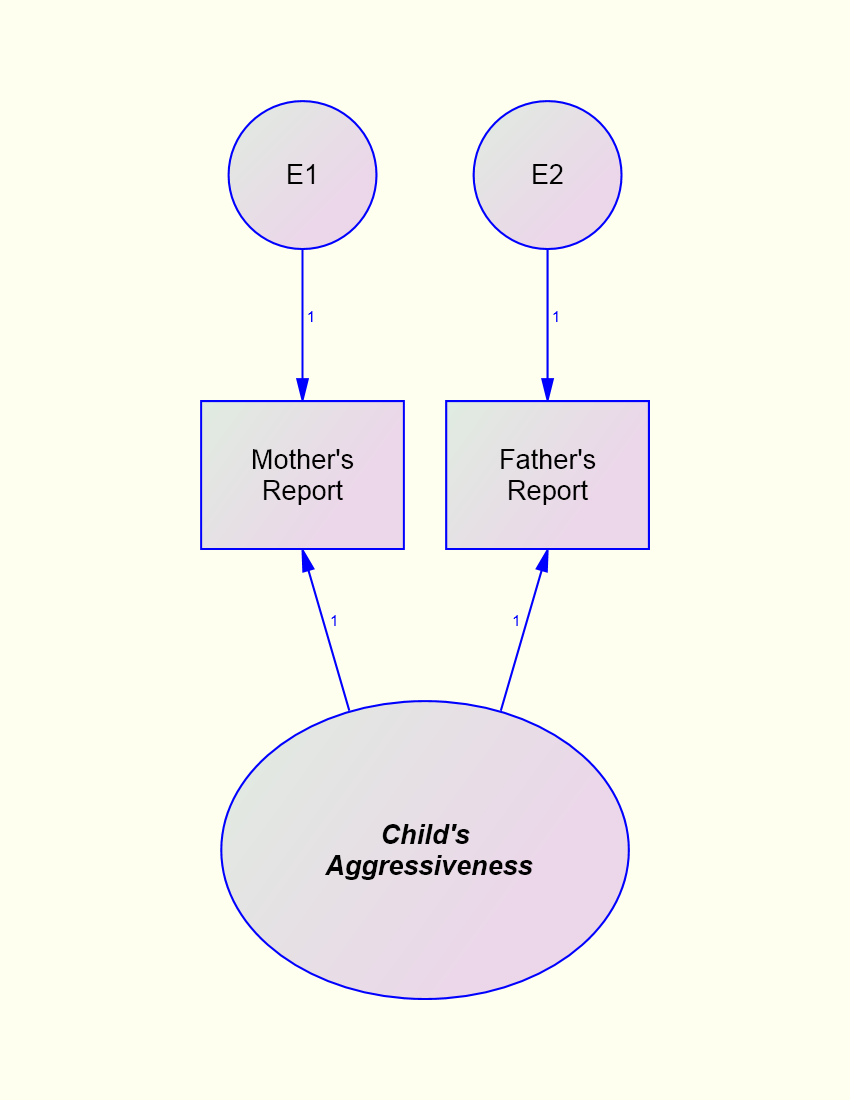
Classical Assumptions
Equations
X1 = T + E1
X2 = T + E2
Equal True Score Variance (both weights for T are 1)
Equal Error Variance: V(E1) = V(E2)
Error Variance Is Independent across Measures rE1,E2 = 0
Given Classical Assumptions: Reliability = Correlation between Measures
Example: To measure the reliability of mothers or fathers report correlate the two variables.
Spearman-Brown Profecy Formula
If the average
inter-item correlation or r is known, it can be used to forecast the reliability
of a test with k items:

This formula gives Cronbach's alpha if all the measures had equal variance which would happen if all the measures were standardized. This formula has many uses. It can be used to determine the reliability of a test if more or less items are used. For instance, if a test has 12 items and an average inter-item correlation of .2, then its reliability is .75. But if the test were to have 24 items, its reliability would be .86 and with 6 items the reliability would be .60.
Another useful formula, again derived from the Spearman-Brown, is estimate of the average inter-item correlation if we know alpha or a and the number of items or k. The formula is

The average inter-item correlation tends to be smaller than you might
think. For instance, the average inter-item correlation for
the Peabody Picture Vocabulary Test is about .08, the
Rosenberg
Self-Esteem Inventory is about .34, and the Beck Depression Inventory is about .26.
Correction for Attenuation
To determine what the
correlation between the two variables would be if the variables' reliabilities
were perfect, a correlation needs to be divided by the square root of the
product of the two variables' reliability. It is in essence,
a forecast of what the correlation would be if the two variables were measured
with many (i.e., infinite) items. The formula
is

where rXX and rYY are the reliabilities of X and Y, respectively. So if the reliabilities of X and Y are both .8, and the correlation between X and Y is .4, then the corrected for attenuation correlation is
.5. A disattenuated correlation is not an ordinary Pearson
correlation and its range is not +1 to -1.One cannot perform
the usual significance test on these correlations. Also one
should avoid disattenuating a correlation if the reliabilities are small to
avoid wild
values.
SEM
Terminology
Indicator: a measure
in structural model than contains measurement error; usually represented by a
box
Relaxing the Assumptions of Classical Test Theory
Correlated errors: Classical theory sets all correlations between error to zero. However, two indicators of the same construct may share variance because they are measured by a common method. That correlation is represented by a curved line in a path diagram.
Unequal loadings: Classical theory sets all factor loadings to one. But it is possible to fix one of the loadings to one and free the other loadings.
Unequal erro variances: Classical theory sets the error variances to b equal, but this assumption can be relaxed.
Estimated True Score The estimate of th true score given X is

where rXX is the reliability of X. The estimate is said to be shrunken
or regressed to its mean.
The Effects of Unreliability in Causal Models
If a causal variable has measurement error, the estimate of its effect is biased, as well as the effects of other variables in the structural equation. Measurement error in the effect variable does not bias its coefficient unless the variables are standardized.
In this case the bias is that the true beta equal the measured beta divided by the square root of the endogenous variable's reliability. For a causal variable X, measurement error biases the estimate of another causal variable Z that is in the equation
when:
Causal variable X has measurement error.
Variables X and Z are correlated.
X affects the endogenous variable.
These three factors multiply to produce bias and so if any one is missing, there is no bias.
Correcting for the Effects due to Measurement Error
There are three ways to remove the biasing effects of unreliability i the causal variable:
Instrumental Variable Estimation
Multiple Indicators (Latent Variable Models)
Correction for Attenuation
The last strategy is problematic because it presumes that reliabilities are exactly known which is never true and sometimes estimation breaks down
because the correlation matrix is ill-conditioned. To implement the strategy, one would input the correlation or covariance matrix and fix the measure's error variance to one minus reliability for the correlation
matrix and (1 - reliability) times the measure's variance for the covariance
matrix. Later on the SEM page, another and better correction
for attenuation strategy is presented (go to that page).
Item Response
Theory
What has been presented above is sometimes called classical test theory
(CTT). A modern alternative to CTT is item response theory
which presumes a dichotomous response.
Item response theory
is very complicated and highly mathematical.